
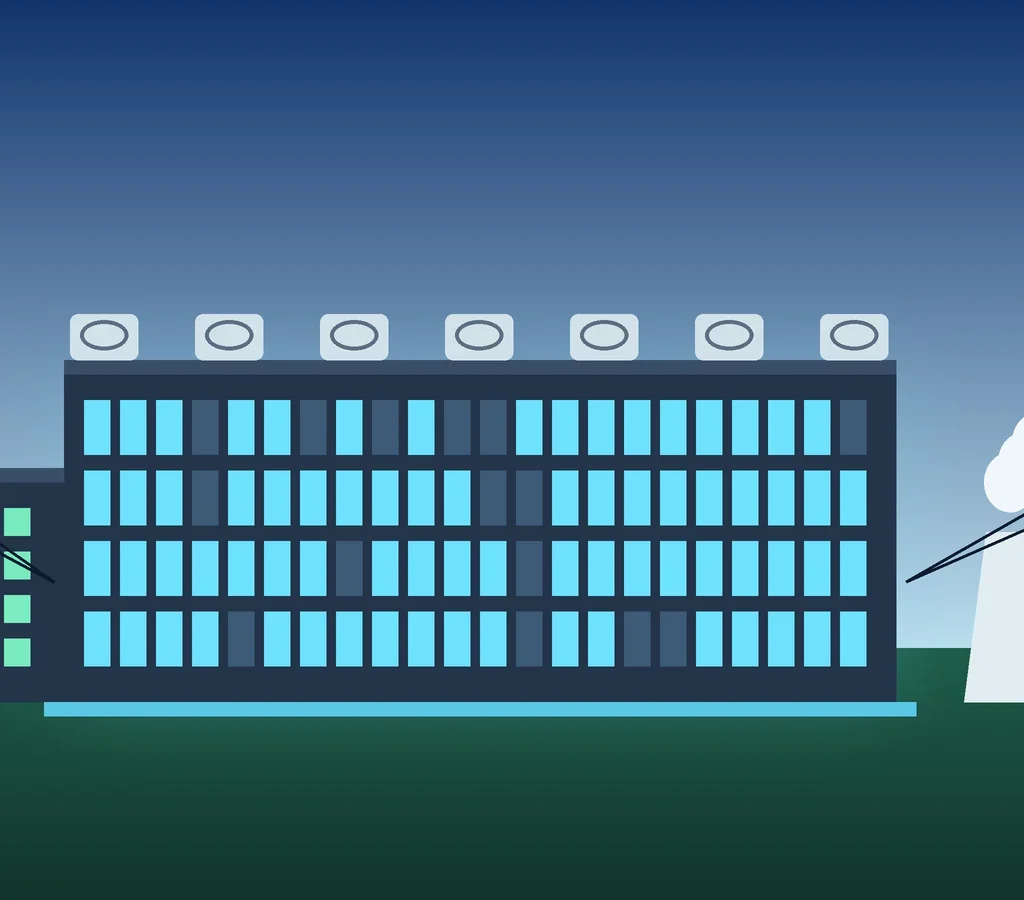
Giant AI data centre with glowing server racks, power lines and cooling towers at dusk
It is 2 a.m. You cannot sleep, so you ask an AI chatbot to plan your week. Three seconds later, you have an answer. It feels free and weightless.
It is not. Somewhere, a building full of hot machines woke up to answer you. It drew electricity, needed cooling and may have used water. Now multiply that by millions of people, every minute of every day.
So here is the real question. Who is paying the real energy bill for the AI revolution, and how much of that bill can the public actually see? That question is the heart of AI energy and infrastructure transparency. This guide explains it in simple words, checks the data, and gives you a 7 point test you can use today.
Table of Contents
What Hides Behind Every AI Answer?
AI energy consumption means the electricity used to build AI (called training) and to answer questions (called inference). AI infrastructure means everything that makes this work: data centres, chips, networks, cooling and power supply.
Think of a data centre as a giant digital factory that makes answers instead of cars. Servers do the thinking. GPUs, chips that do thousands of calculations at once, handle the heavy work. Networks connect them. Cooling stops overheating.
Training is like studying for an exam. It happens once but is huge. Inference is answering questions every day, billions of times.
Why one number never works. Google estimated in 2025 that its median Gemini text prompt uses 0.24 watt hours of energy. OpenAI’s CEO said in 2025 that an average ChatGPT query uses about 0.34 watt hours. Older outside estimates for earlier models reached roughly 3 watt hours, as listed in Google’s own technical paper. The gap exists because models, hardware, query length, measurement boundaries and electricity sources all differ. Images, video and long reasoning tasks use more.
What the Numbers Say About AI Energy and Infrastructure Transparency
For any statistic, ask who produced it, what it measures, and whether it is measured or estimated.
- Global view. The International Energy Agency (IEA, 2025) estimates data centres used about 415 TWh of electricity in 2024, roughly 1.5% of global electricity. One TWh is one billion kilowatt hours. Its Base Case projects around 945 TWh by 2030. The first number is a modelled estimate. The second is a forecast. See the IEA Energy and AI report.
- United States view. Lawrence Berkeley National Laboratory (LBNL, December 2024) estimated 176 TWh in 2023, or 4.4% of US electricity. Its 2025 update, published in June 2026, gives a 2030 reference case of 649 TWh (11.8%), with a range of 521 to 843 TWh. These come from equipment shipments and assumptions, not from meters.
- Do not mix them. The IEA figure is global. The LBNL figure is American. Different boundaries mean different percentages.
What this tells us. The IEA says data centres drive only about one tenth of global demand growth to 2030, less than motors, air conditioning or electric vehicles. But the IEA also finds that data centres cluster. Nearly half of US capacity sits in five regional clusters, so local grids feel the pressure first.
What it cannot prove. It cannot tell you which company uses what, how much a single AI service costs, or what 2027 will look like. That gap is exactly why transparency matters.
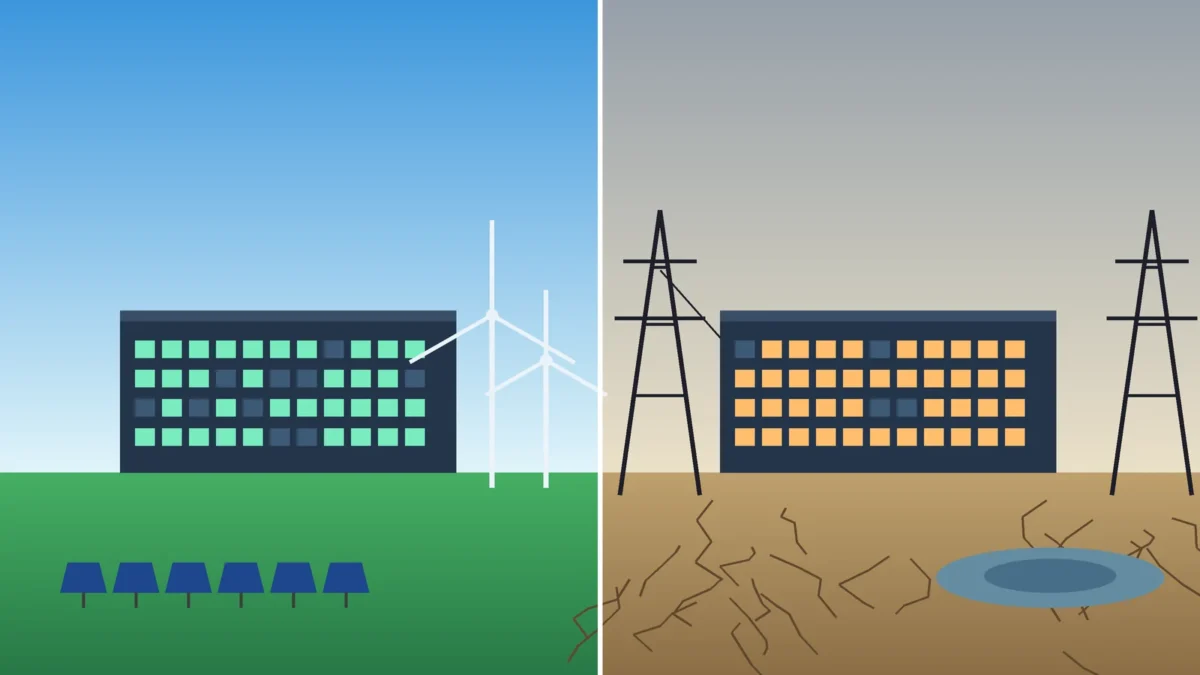
Split view of a clean energy powered data centre and one facing power and water limits
Water: The Quiet Part of the Bill
Cooling is the other half of the story. LBNL (2024) estimated that US data centres directly consumed about 17.4 billion gallons of water in 2023. It estimated 211 billion more gallons were consumed at power plants to make their electricity, about 12 times higher. These are modelled estimates, and the indirect figure is often missing from company reports.
Nationally, this is a small share of total water use. Locally, a large site in a dry town can matter a lot, so water needs local reporting.
Why 2027 Matters for AI Energy and Infrastructure Transparency
Nobody can confirm 2027 facts today, so keep three boxes separate.
Already established
- Data centre electricity use is rising, and AI is a main driver.
- Sites cluster in a few regions, which strains local grids.
- Europe moved toward rules. In September 2026 the European Commission proposed a common rating scheme with A to G labels for energy and water efficiency. See the EU data centre page. Check its final status before quoting it.
- The Green Software Foundation ratified a method for measuring AI emissions, called SCI for AI.
Forecasts
- The IEA expects the first small modular reactors to join data centre supply around 2030. Gas, nuclear and renewables all share the growth.
Emerging possibilities
- Liquid cooling can cut water and energy use, according to the Environmental and Energy Study Institute.
- Efficient chips, small specialised models and edge computing (running AI close to the user) could reduce demand. The IEA’s High Efficiency Case puts 2035 demand about 20% below its Base Case.
In 2027, watch who actually reports. Promises are cheap. Data is not.
The 10 Questions Behind Real Transparency
Real transparency means a company can answer these:
- How much electricity do its data centres use?
- What share is renewable, and is it matched by hour and place?
- How much water is used for cooling?
- Where are the main sites?
- What is the carbon footprint of training and of inference?
- Which hardware is used, and how efficiently?
- Are numbers measured or estimated?
- Who pays for new grid upgrades?
- How do nearby communities gain or lose?
- Has anyone independent checked the answers?
A company wide sustainability report adds everything together. AI specific reporting shows how much comes from AI workloads. The first can hide the second.
Verification matters. Google itself notes that its per prompt figures were not independently verified. That is honest, and it shows the gap.
Transparency Compared
| Area | Low transparency | High transparency |
|---|---|---|
| Electricity | General claims | Measured consumption |
| Water | Limited disclosure | Clear direct and indirect reporting |
| Carbon | Broad estimates | Workload related accounting |
| Infrastructure | Hidden details | Site level information |
| Energy sources | General renewable claims | Verifiable sourcing |
| Accountability | Company statements | Independent checks |
Low transparency protects trade secrets and is cheap, but the public cannot judge anything. High transparency builds trust and helps planning, but costs more and numbers may be misread without context.
Three more comparisons, with no universal winner:
- Large vs small models. Large models handle hard tasks. Small ones often cost far less per answer. Choose by the job.
- Traditional vs AI focused data centres. The IEA says a typical AI focused site uses as much electricity as 100,000 households, and the largest under construction will use 20 times that.
- Renewable claims vs actual use. Buying renewable credits for a year is not the same as running on clean power every hour. Even EU draft rules debate how closely claims must match place and time.
The 7 Point Test for AI Energy and Infrastructure Transparency
This is an original kritiinfo.com editorial tool, not an official certification. Score each item: 0 = not disclosed, 1 = partly disclosed, 2 = clearly disclosed with evidence. Maximum: 14.
| # | Dimension | A responsible company shares |
|---|---|---|
| 1 | Energy | AI related electricity use, measured |
| 2 | Water | Direct and indirect water use |
| 3 | Carbon | Training and inference emissions, with method |
| 4 | Renewable sourcing | Share, source, and time matching |
| 5 | Locations | Where sites are and what grid serves them |
| 6 | Hardware efficiency | Chip types and efficiency results |
| 7 | Auditing | Independent verification and a named owner |
How to read it: 0 to 4 is low, 5 to 9 is partial, 10 to 14 is strong. A high score does not mean low impact. It means you can check the claims.
A Hypothetical Example (Not a Real Company)
Imagine a company planning a large AI data centre near a small town. It promises faster services and jobs. This story is invented for teaching. It uses no real statistics.
Residents ask fair questions. Will power bills rise? Will water run short? How much electricity will the site use? Will clean energy really power it? Who pays for grid upgrades?
With low transparency, the company answers with a brochure. Rumours spread and the project stalls.
With high transparency, it publishes expected power and water use, the cooling method, the energy contracts, and who funds the grid work. The council can set fair rules. Investors can judge risk. Employees see a stable employer. Residents can check promises later. Trade offs remain, but the choice is informed.
Who Should Act on AI Energy and Infrastructure Transparency
- Ordinary users: ask whether AI companies publish meaningful sustainability data.
- Small businesses: compare efficiency and reporting before choosing an AI provider.
- Investors: study energy exposure and infrastructure spending.
- Electricity providers and governments: plan grids early and require consistent reports.
- Tech companies: publish comparable, independently checked numbers.
- Communities: ask for facts before approval, not after.
Benefits and Limits
Benefits: public trust, smarter investment, better efficiency, stronger accountability, better grid planning and informed consumer choices.
Limits: commercial secrecy, different standards, difficulty measuring a single query, tangled global power supply, hard to measure indirect emissions, and the risk of misleading green claims.
Five Common Misconceptions
- “Every AI question uses the same energy.” No. Model, length, task and hardware change it.
- “Renewable claims mean zero impact.” No. Building hardware, water use and grid effects remain.
- “Bigger models are always better.” No. A smaller model may do a simple job well.
- “Data centres use only electricity.” No. Cooling uses water, directly and through power plants.
- “A company carbon report explains AI’s footprint.” Not fully. AI use may be buried inside totals.
What to Do Next
- Read the sustainability reports of major AI companies.
- Check whether AI related electricity is reported separately.
- Look for credible water and carbon numbers.
- Compare efficiency claims with independent evidence.
- Support responsible AI development instead of accepting marketing blindly.
In short, AI energy and infrastructure transparency turns marketing claims into checkable facts.
The future of AI should not only be measured by how intelligent machines become, but also by how responsibly we power them.
FAQs
1. What is AI energy and infrastructure transparency? It means AI companies openly share the electricity, water, carbon, location and hardware facts behind their services, in ways others can check.
2. Why do AI data centres use so much electricity? Thousands of powerful chips run at once, and they need cooling and networking too.
3. How does AI affect global electricity demand? The IEA (2025) projects data centre demand rising from about 415 TWh in 2024 to about 945 TWh by 2030. That is a forecast, and AI is a main driver.
4. Does AI use a lot of water? Per prompt, Google estimates about 0.26 mL for a median text prompt. In total, LBNL (2024) estimated billions of gallons in the US. Both can be true.
5. Can renewable energy make AI fully sustainable? Not alone. Timing, local grids, water and hardware still matter.
6. How can I check if an AI company is responsible? Use the 7 Point Test above and look for measured, independently checked data.
7. What should we watch in 2027? Rules like the EU label, grid shortages, liquid cooling, efficient chips and whether AI specific reporting becomes common.
8. Why should businesses care about AI energy and infrastructure transparency? Energy costs, reporting rules and customer trust can all affect an AI provider you depend on.